■ jqPlot 막대 2개의 데이터 하나로 합치기
jqplot_stacked_bar_chart_with_cumulative_point_labels.php
|
<!DOCTYPE html PUBLIC "-//W3C//DTD HTML 4.01 Transitional//EN" "http://www.w3.org/TR/html4/loose.dtd">
<html>
<head>
<title>jQplot</title>
<script type="text/javascript" src="./js/jquery-2.1.0.min.js"></script>
<script type="text/javascript" src="./js/jquery.jqplot.js"></script>
<script type="text/javascript" src="./js/plugins/jqplot.barRenderer.js"></script>
<script type="text/javascript" src="./js/plugins/jqplot.categoryAxisRenderer.js"></script>
<script type="text/javascript" src="./js/plugins/jqplot.pointLabels.js"></script>
<link rel="stylesheet" type="text/css" href="./css/jquery.jqplot.css"/>
<script type="text/javascript">
jQuery(document).ready(function(){
var firestLine = [14, 32, 41, 44, 40, 37, 29];
var secondLine = [7, 12, 15, 17, 20, 27, 39];
jQuery("#chart").jqplot([firestLine, secondLine], {
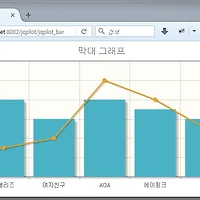
title : "막대 그래프"
, stackSeries : true // stackSeries 가 true로 설정되어 있어야 두개의 데이터가 합쳐진다.
, seriesDefaults : {
renderer : jQuery.jqplot.BarRenderer
, rendererOptions : { barMargin : 25 }
, pointLabels : {
show : true
, stackedValue : true
}
}
, axes: {
xaxis : { renderer : jQuery.jqplot.CategoryAxisRenderer }
}
});
});
</script>
</head>
<body>
<div id="chart" style="width:780px;height:304px;">
</body>
</html>
|
02. 출력결과는 두개의 리스트의 데이터가 합쳐져서 나타나는 것을 확인 할 수 있다.

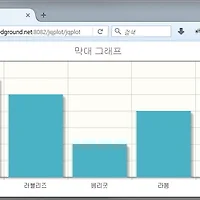
※ 만약 stackSeries이 false로 설정된 경우 데이터는 아래와 같이 분할되어 나타난다.