<!DOCTYPE html PUBLIC "-//W3C//DTD HTML 4.01 Transitional//EN" "http://www.w3.org/TR/html4/loose.dtd">
<html>
<head>
<title>jQplot</title>
<script type="text/javascript" src="./js/jquery-2.1.0.min.js"></script>
<script type="text/javascript" src="./js/jquery.jqplot.js"></script>
<script type="text/javascript" src="./js/plugins/jqplot.barRenderer.js"></script>
<script type="text/javascript" src="./js/plugins/jqplot.categoryAxisRenderer.js"></script>
<script type="text/javascript" src="./js/plugins/jqplot.pointLabels.js"></script>
<link rel="stylesheet" type="text/css" href="./css/jquery.jqplot.css"/>
<style type="text/css">
#chart .jqplot-point-label {
border:1.5px solid #AAAAAA;
padding:1px 3px;
background-color:#EECCDD;
}
</style>
<script type="text/javascript">
jQuery(document).ready(function () {
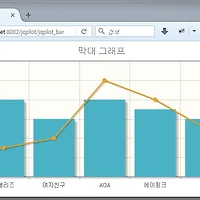
var line = [['트와이스', 9], ['러블리즈', 8], ['걸스데이', 4], ['에이핑크', 6], ['AOA',
8], ['라붐', 6], ['여자친구', 6], ['블랙핑크', 4], ['레드벨벳', 5]];
jQuery("#chart").jqplot([line], {
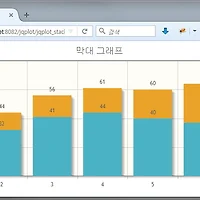
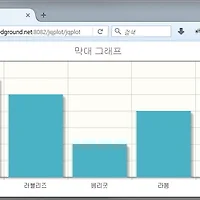
title:"막대 그래프"
, seriesDefaults:{ renderer:jQuery.jqplot.BarRenderer }
, series:[
{
pointLabels:{
show:true
, labels:['JYP', '울림', '드림티', '플랜에이', 'FNC', 'NH EMG', '쏘스뮤직', 'YG', 'SM']
}
}
]
, axes:{
xaxis:{ renderer:jQuery.jqplot.CategoryAxisRenderer }
, yaxis:{ padMax:1.3 }
}
});
});
</script>
</head>
<body>
<div id="chart" style="width:780px;height:304px;">
</body>
</html>
|